重要なお知らせ
2021年7月12日
上野エンジニアリング株式会社との業務提携について
2020年8月24日
新型コロナウイルス感染拡大防止に関する当社の対応について
2023年12月26日
年末年始休業のおしらせ
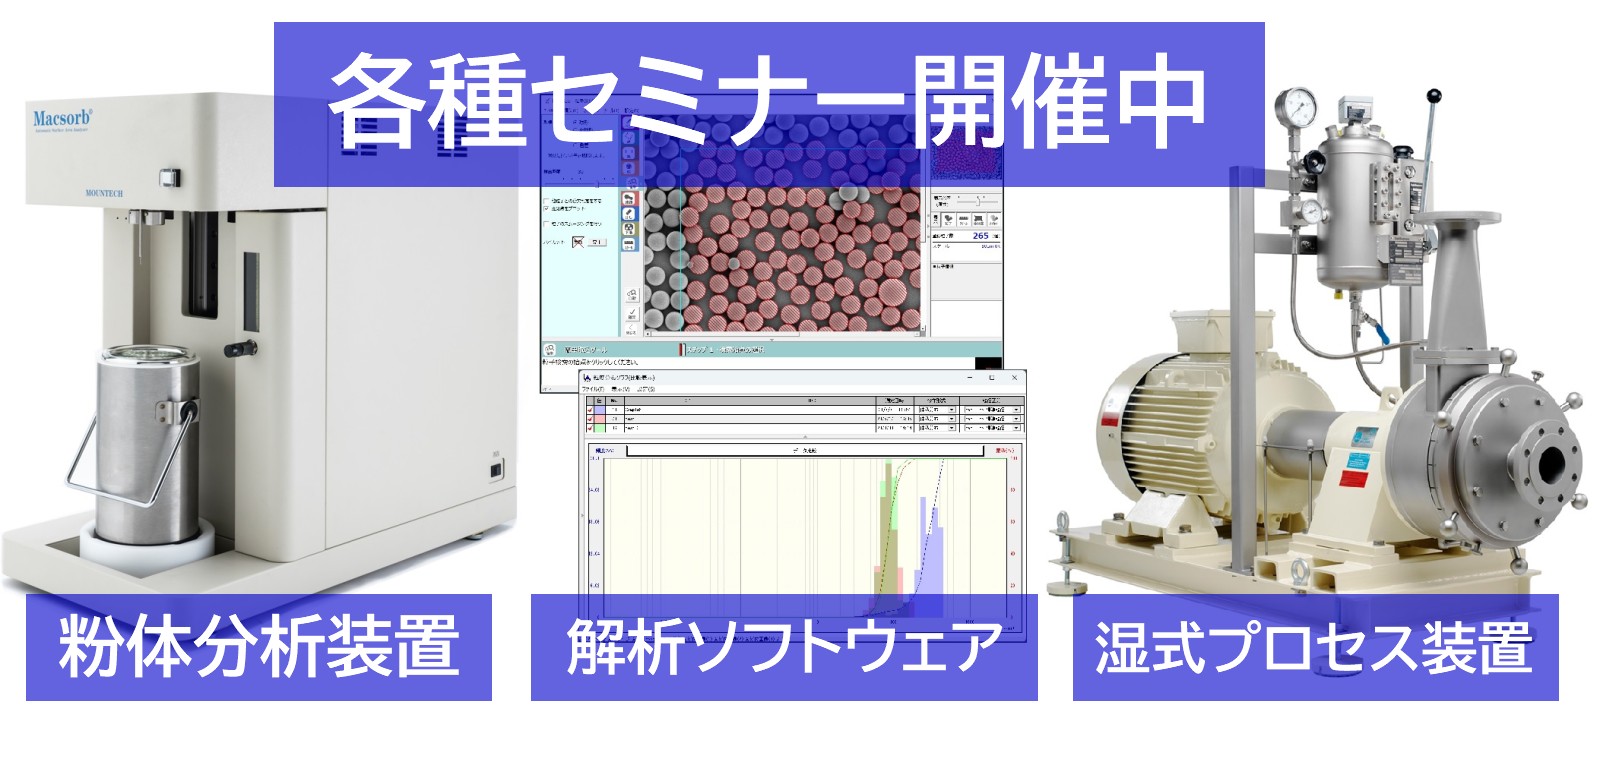
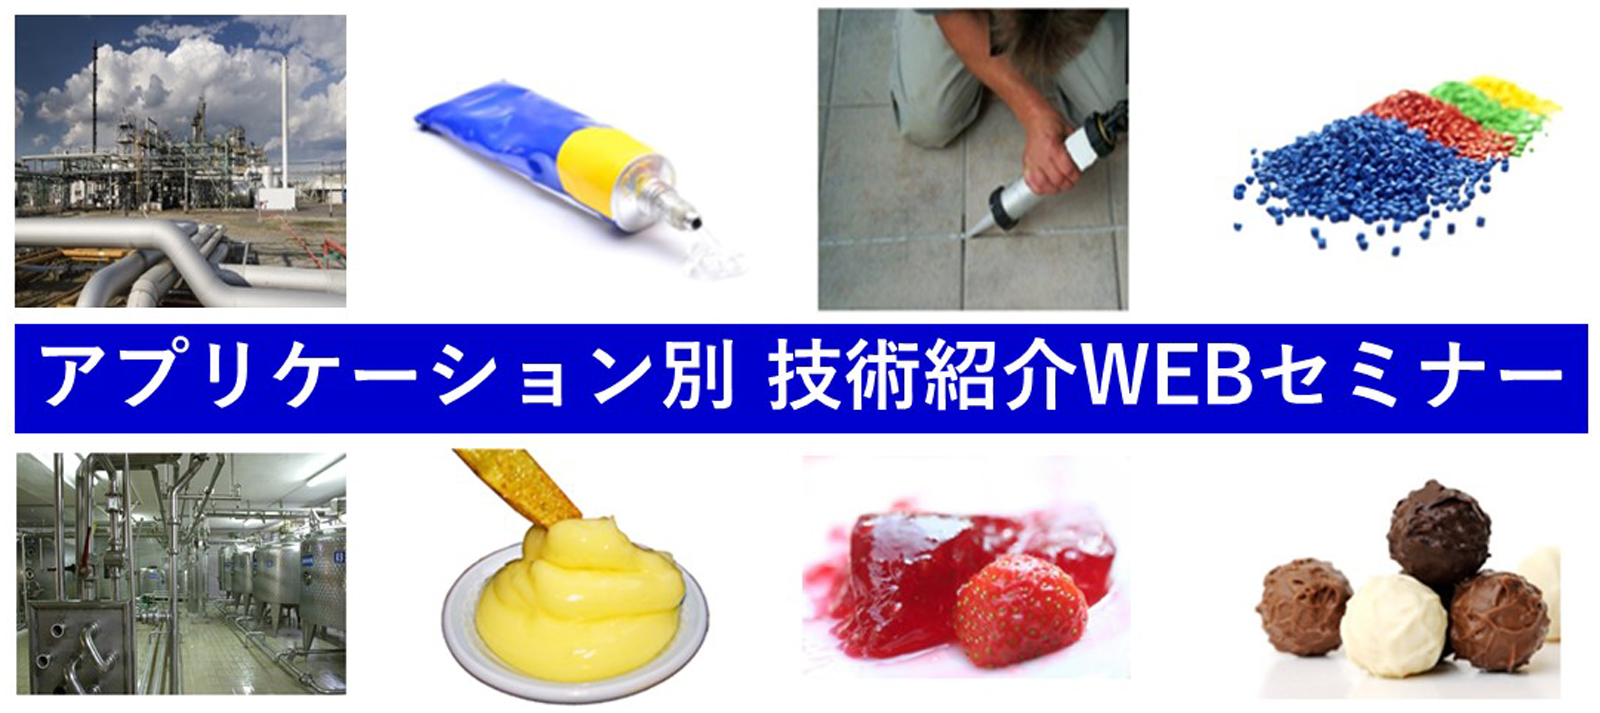
WEBセミナー
2022年8月26日
【重要なお知らせ】WEBセミナー 「製品・技術紹介WEBセミナー配信形式変更のお知らせ」
お知らせ
2022年7月29日
7月28日付『化学工業日報』特集記事掲載のお知らせ
2022年7月25日
7月11日付 化学工業日報 新製品記事掲載のお知らせ
2022年7月4日
西日本営業所閉鎖のご挨拶
社員コラム
2022年6月27日
『天神鱧』
イベント
食品開発展2022、粉体工業展東京2022 出展のお知らせ
新着情報一覧